
Music Habits of College Students
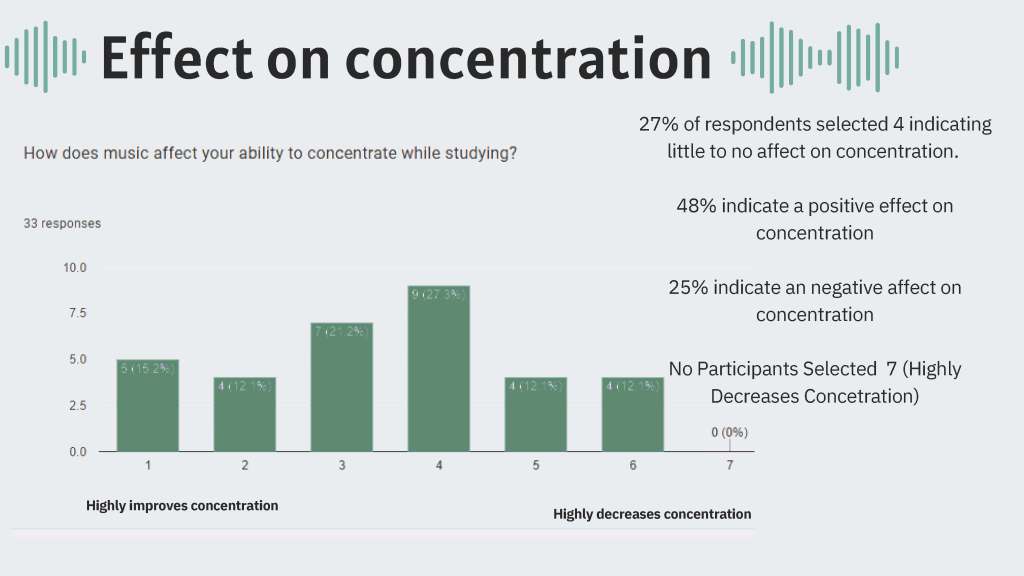
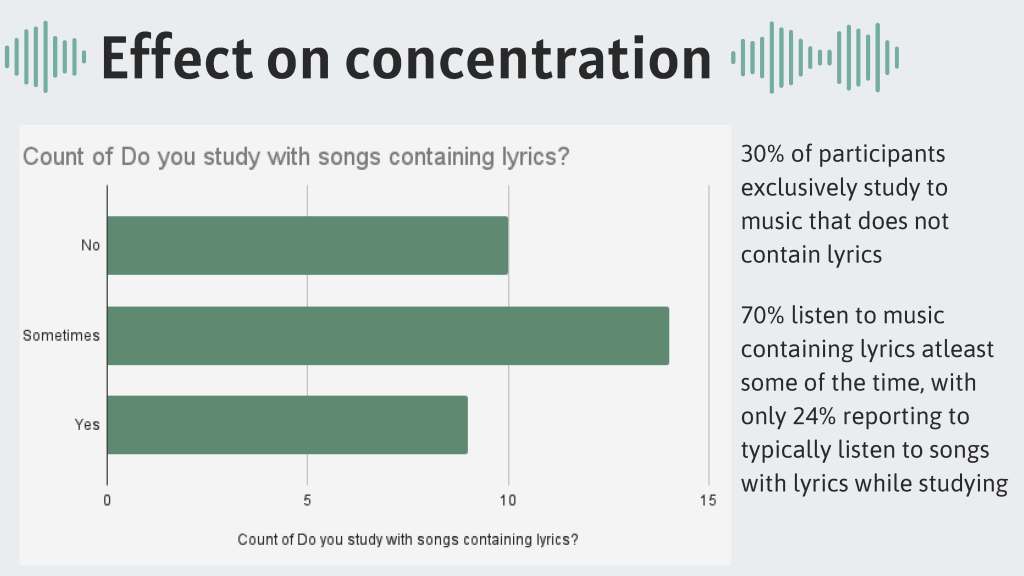
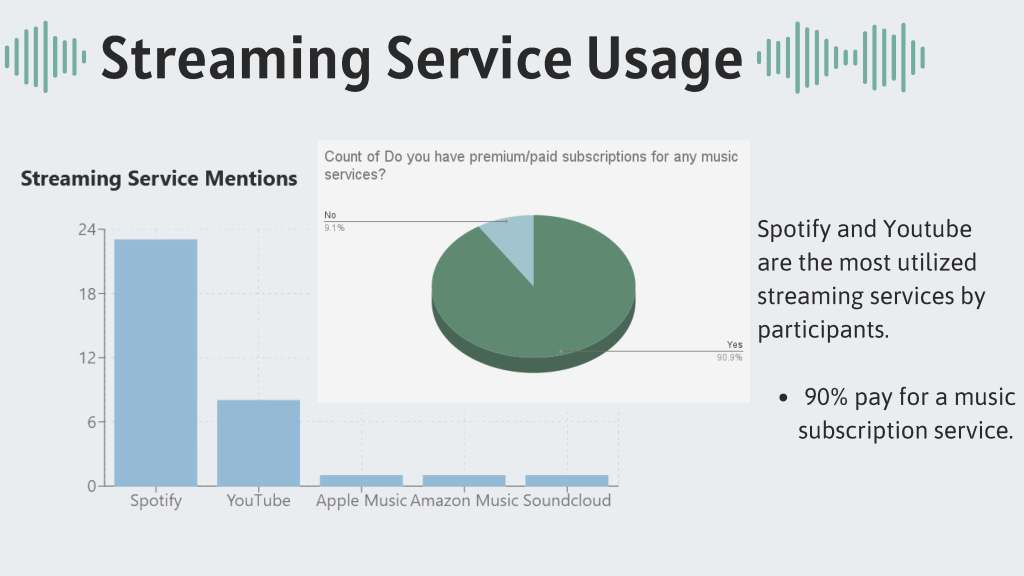
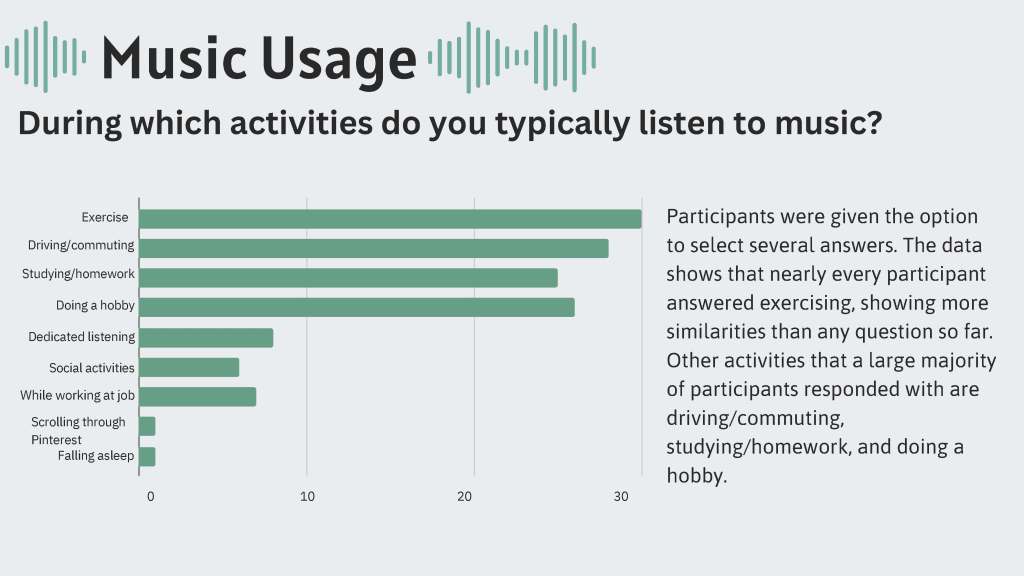
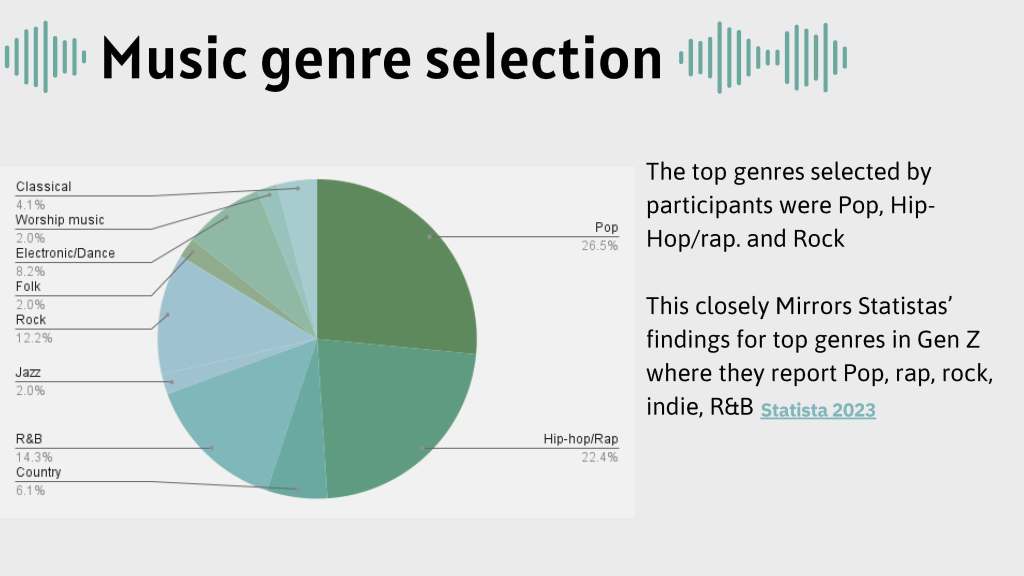
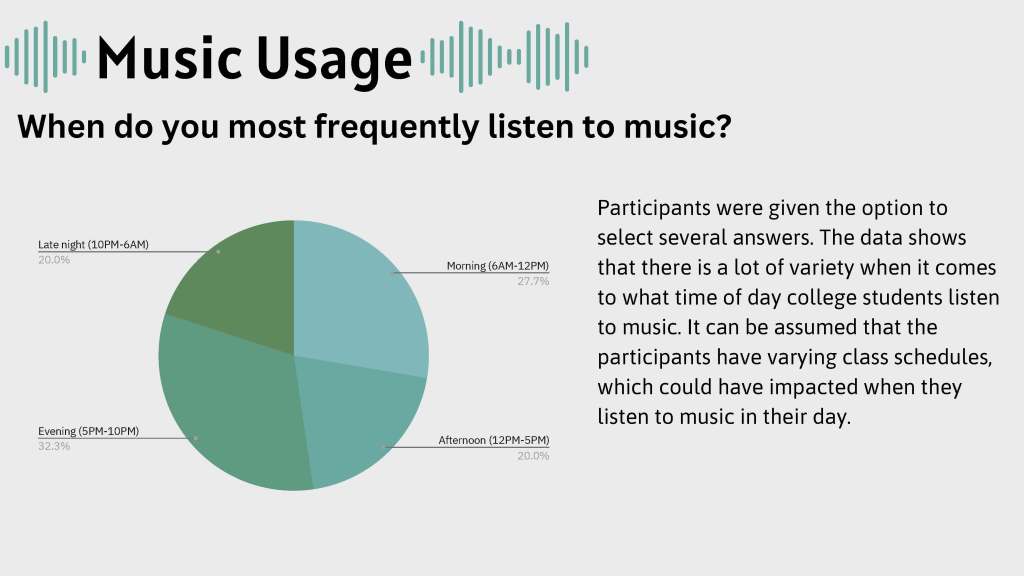
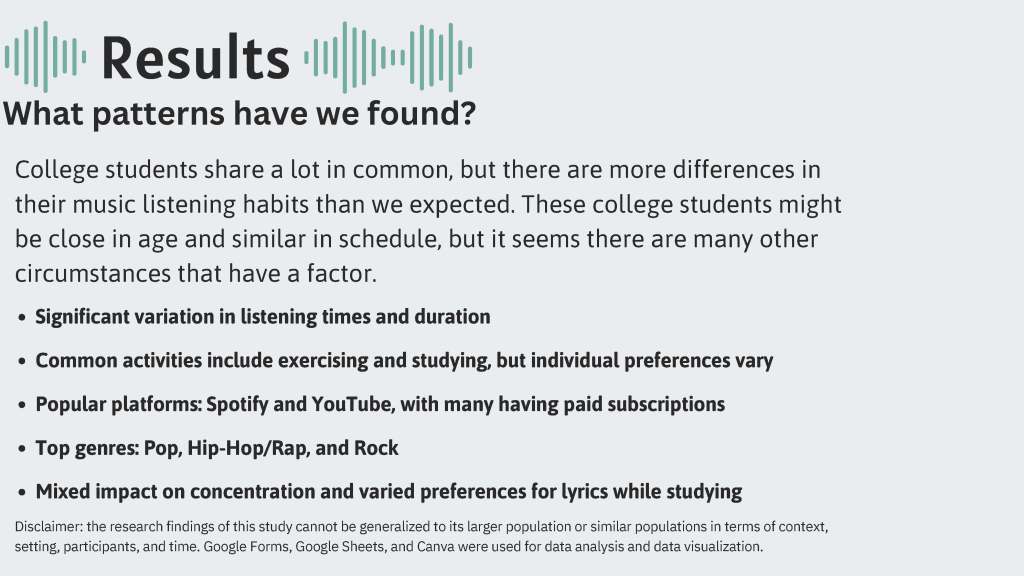
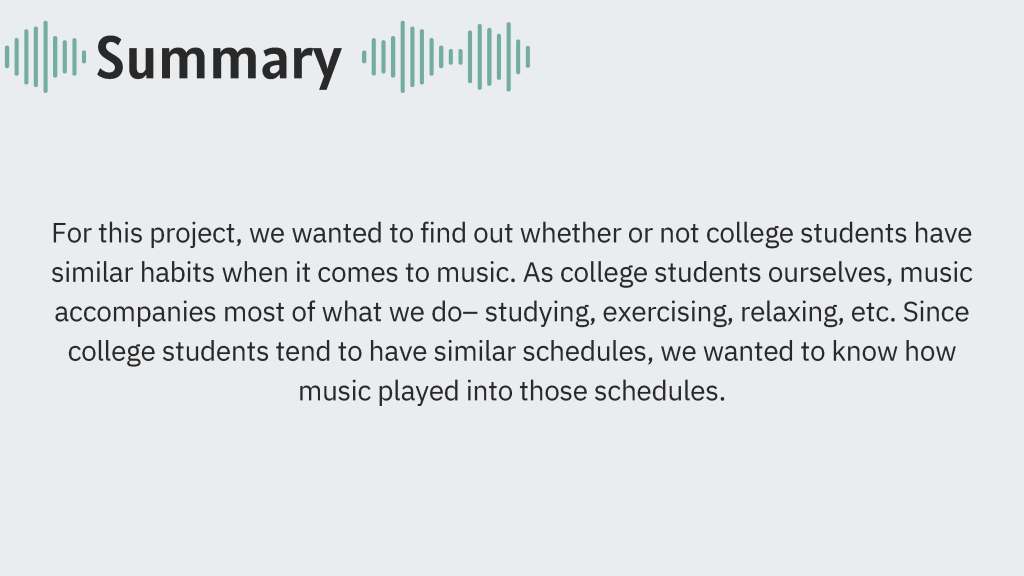
- Project Goals: Investigate college students’ music listening habits, preferred genres, streaming platforms, and its impact on concentration.
- Tools Used: Google Forms, Google Sheets, Canva for visualization.
- Creative Intent: Showcase the diversity in music habits and preferences through engaging charts and infographics.
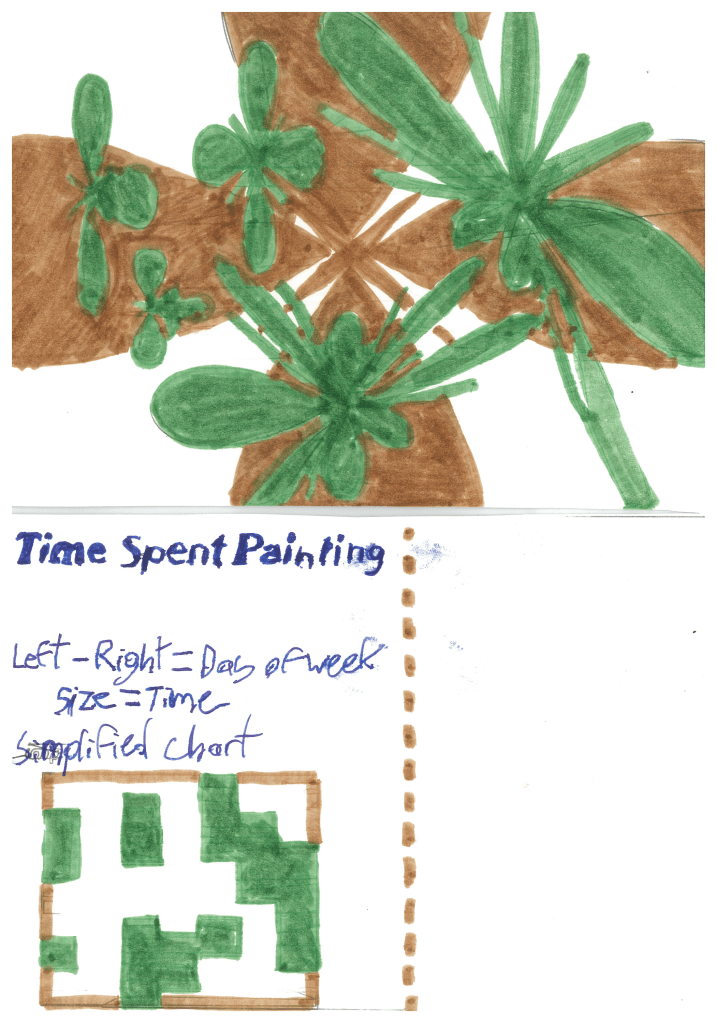
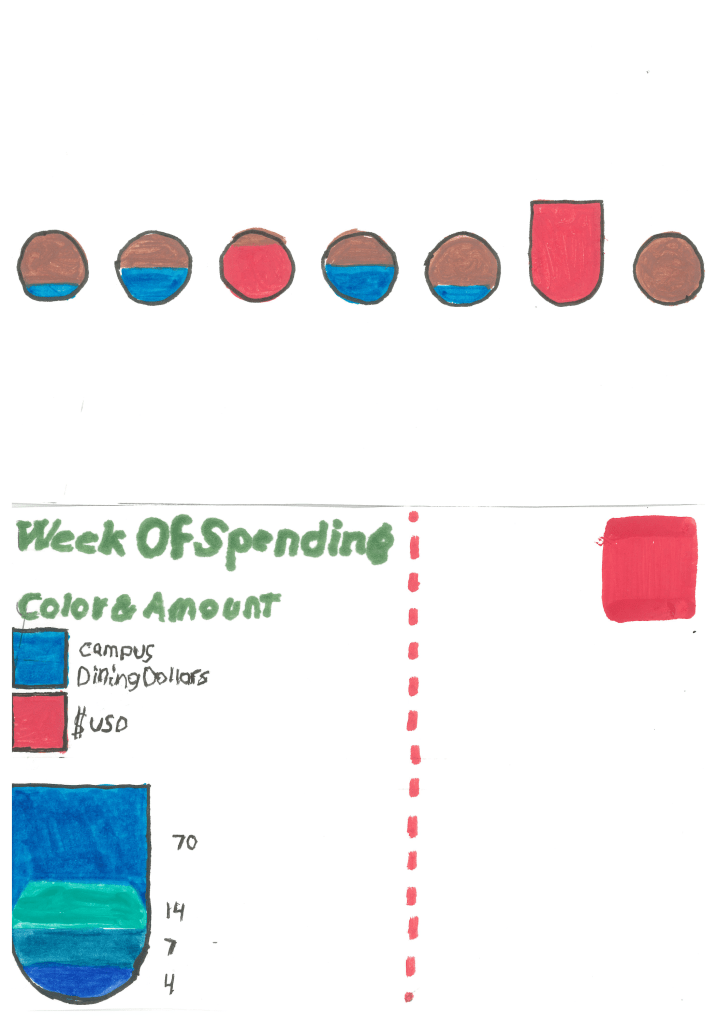
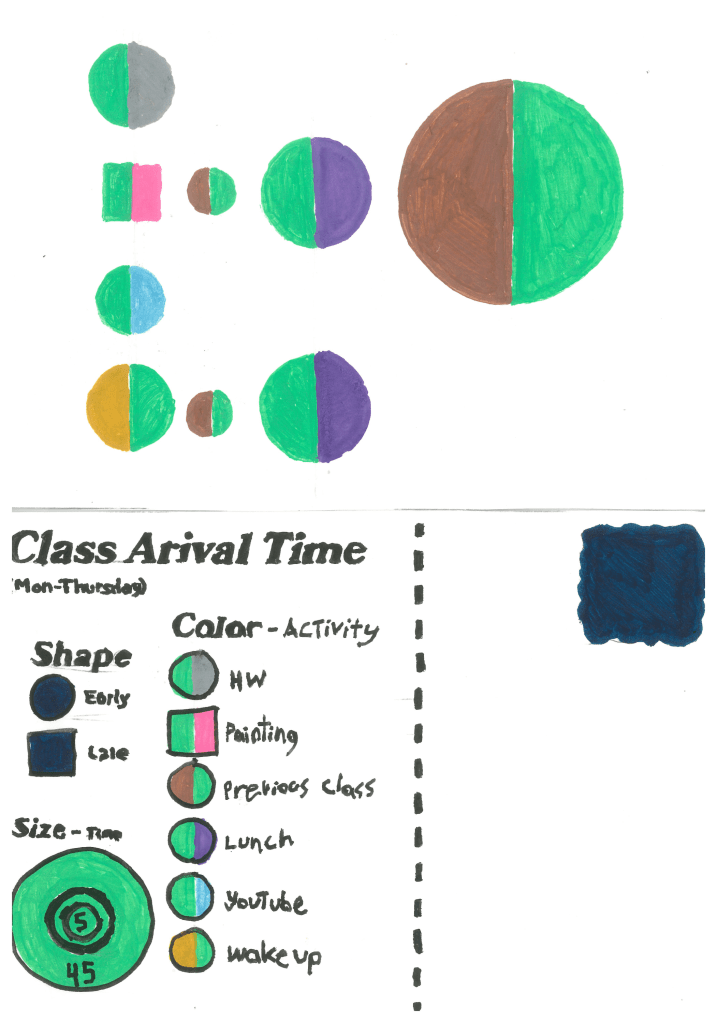
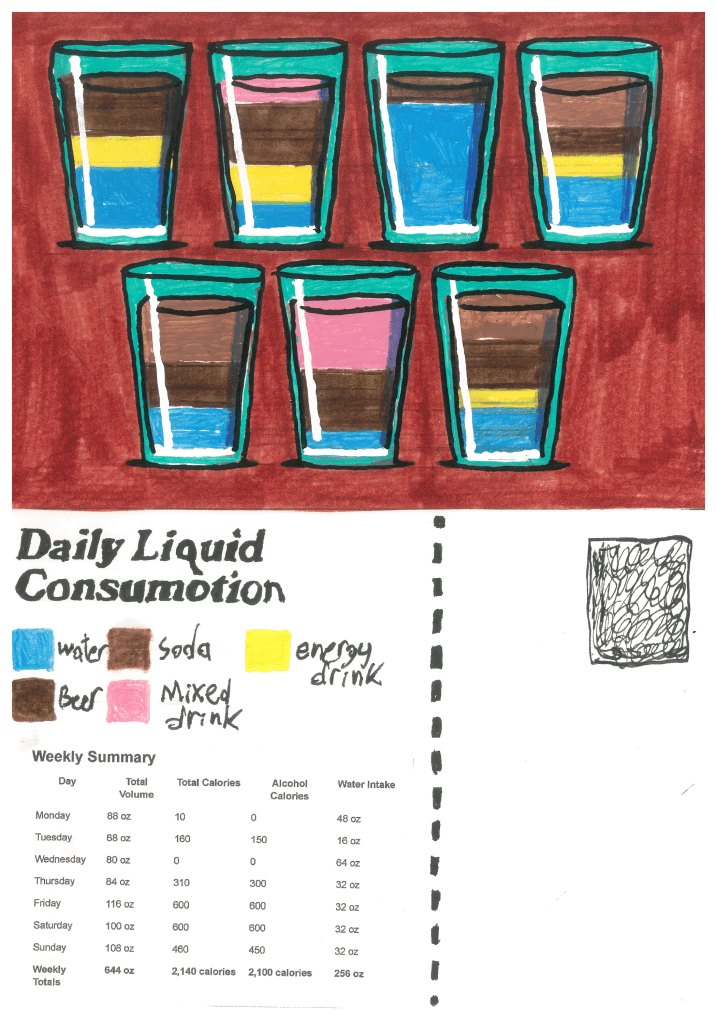
Weekly Data Visualization Postcards
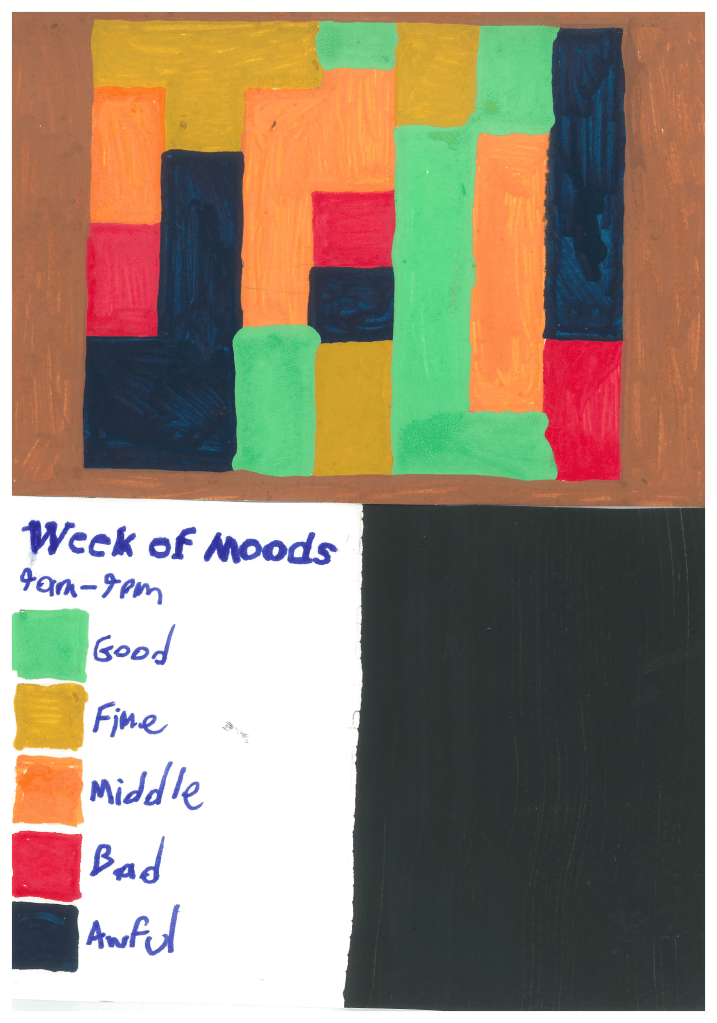
- Project Goals: Track daily life themes (e.g., laughter, phone usage) and creatively visualize patterns and insights.
- Tools Used: Traditional drawing tools (pencils, markers) for postcard creation.
- Creative Intent: Transform personal observations into artistic visualizations using symbols, charts, and diagrams to uncover meaningful trends.
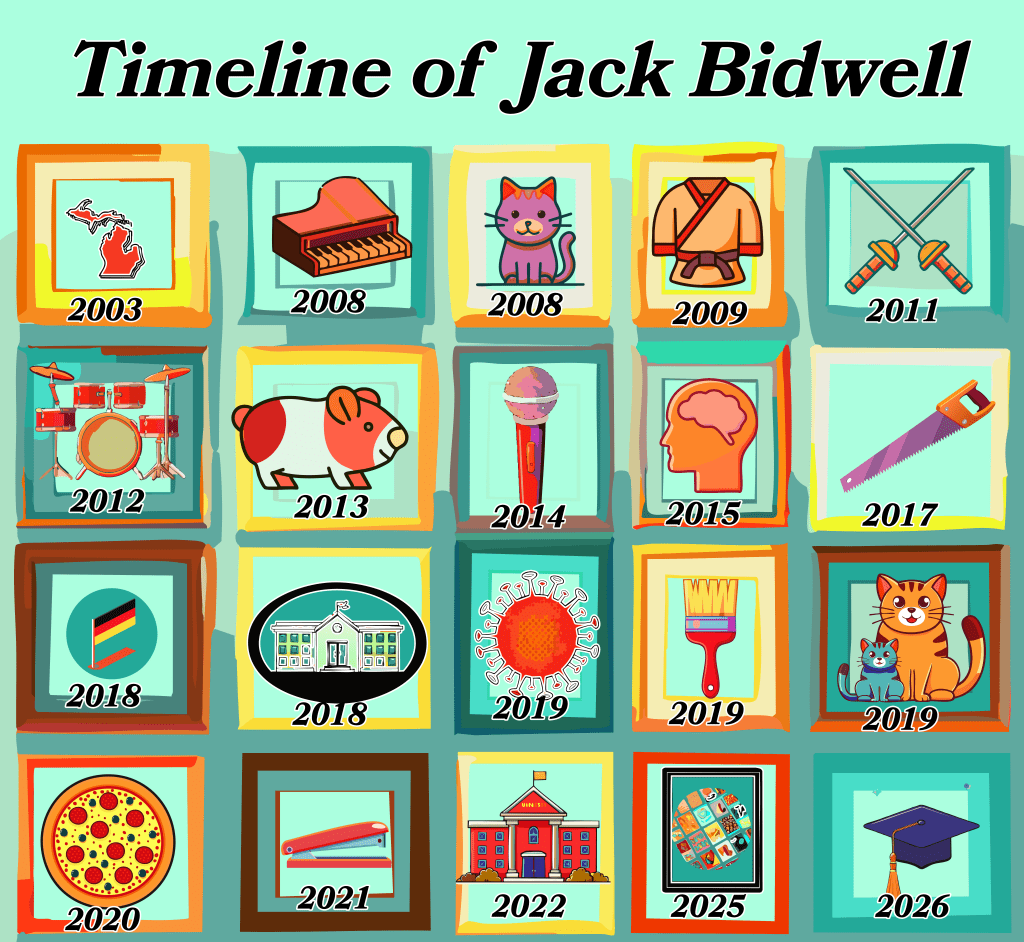
Timeline Infographic
- Project Goals: Create a personal timeline with 20+ meaningful life events using design principles to visually narrate a life story.
- Tools Used: Adobe Illustrator.
- Creative Intent: Combine thoughtful design elements like fonts, color schemes, and icons to craft a visually compelling and organized timeline.
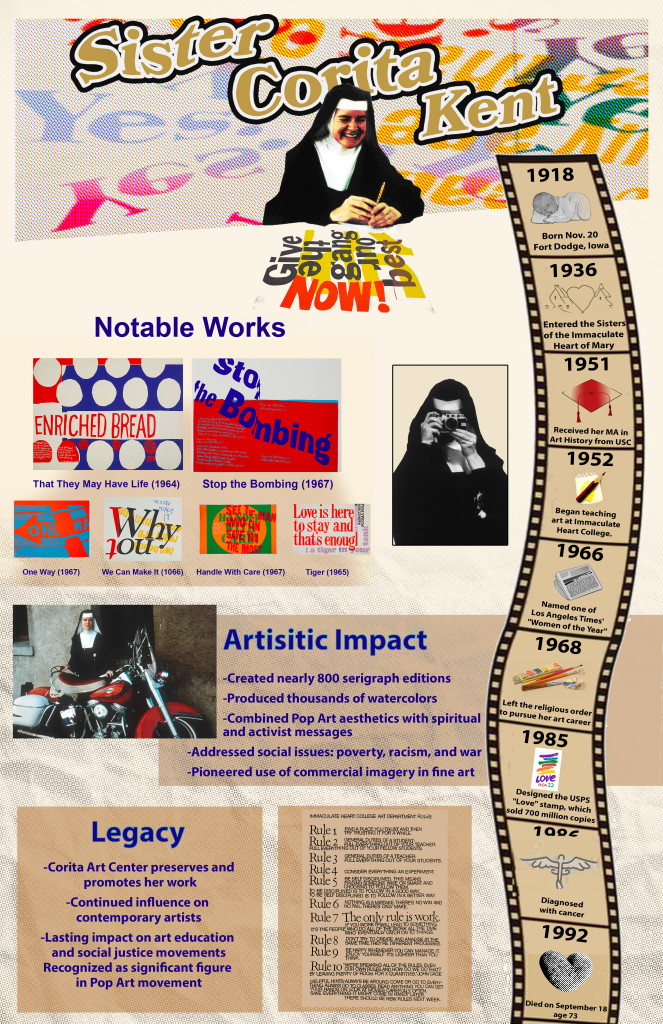
Infographic Project
- Project Goals: Create a visually compelling infographic showcasing a world-famous person’s story and impact.
- Tools Used: Adobe Illustrator.
- Creative Intent: Highlight their biography, achievements, and legacy through visuals and storytelling.
